Microsoft recently released some great documentation and an example SSIS package on only pulling down the changes from Project Online to your custom SQL database – this will improve the efficiency of your Project Online SSIS packages. I recommend you take a look if you haven’t already:
For a walkthrough of an example SSIS package for Project Online see:
Or a great example from Martin here:
March 26, 2014 at 1:24 pm | Posted in Add-on, Administration, Configuration, Customisation, Functionality, Information, Installation, Reporting, T-SQL | 10 Comments
Tags: Office365, Project 2013, Project Online, Project Server 2013, PS2013, SharePoint 2013, SharePoint Online, SSIS, SSRS
Tags: Office365, Project 2013, Project Online, Project Server 2013, PS2013, SharePoint 2013, SharePoint Online, SSIS, SSRS
Following on from my post earlier today regarding the SSIS component that enables you to extract data from ODATA feeds in Office 365, I have created a blog post that demonstrates this new functionality. See the steps below:
Firstly I installed the SQL Server data tools and Integration Services feature on my Test Project Server / SharePoint 2013 box (only server I had available at the time). Once you have access to SQL Server data tools, download and install the ODATA SSIS component from the link below:
Also if this isn’t on a SharePoint / Project Server 2013 server – which in reality it wont be, you will also need the SharePoint client DLLs, these can be downloaded here:
When I tried the new SSIS component on the SQL 2012 Server the connection failed and it complained about the SharePoint.Client.Runtime.dll:
I didn’t test deploying the SharePoint client components to the SQL Server but I guess this should work.
Once everything is in place, launch SQL Server data tools for SQL Server 2012 and create a new Integration Services project:
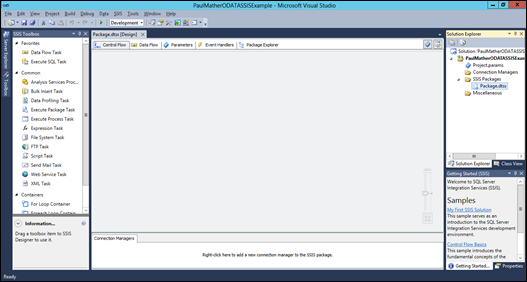
Click OK and you will see the following screen:
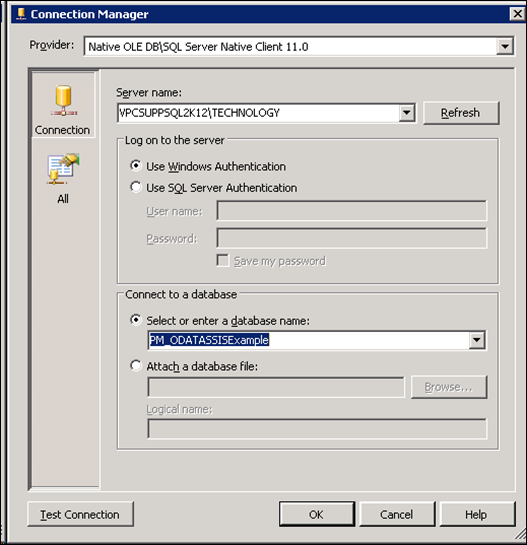
On the control flow tab, at the bottom you will see Connection managers. Right click and create a new OLEDB Connection to the target database:
Before I created this, I did create a new empty SQL database:
Create another connection to the ODATA feed URL using the New Connection > ODATA option:
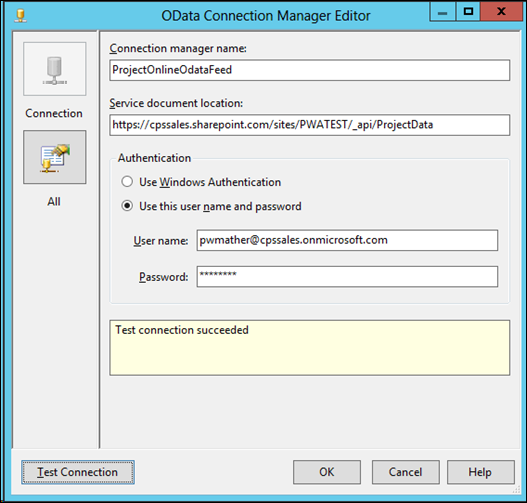
Create the ODATA connection to your ODATA tenant:
Specify an account that has access to the ODATA feed. Notice the Service document location is just the base ProjectData ODATA URL.
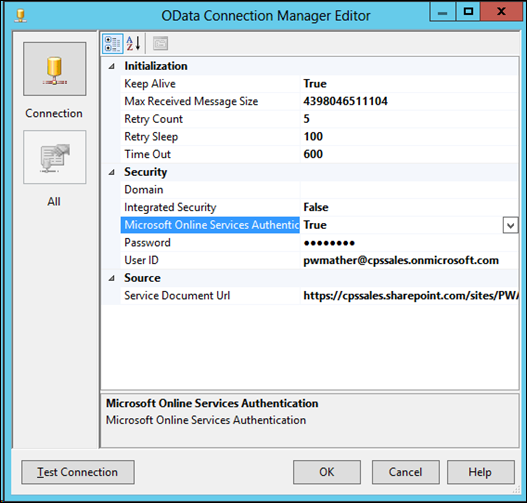
Click the All button and change the Microsoft Online Services Authentication to True:
Test the connection to confirm it is successful then click ok.
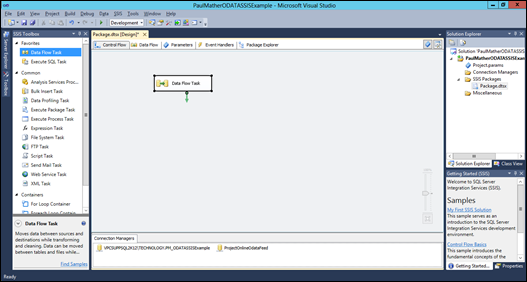
Add a Data Flow Task to the control flow:
Double click the data flow task and you will go to the Data flow tab:
Drag ODATA source from the toolbox to the data flow sheet:
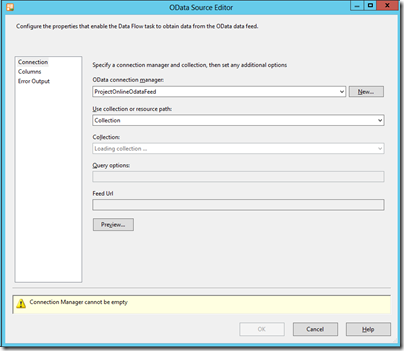
Double click the ODATA source to see the properties:
Complete the details, selecting the ProjectOnlineODATAFeed connection and you will see the Collection property load the collection, in this case it is the tables on the ODATA feed:
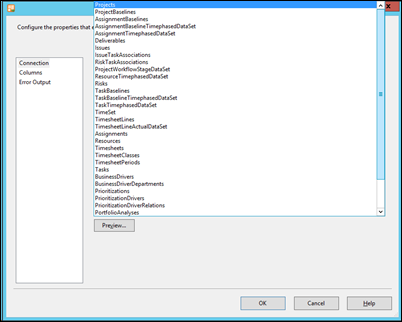
Once loaded you will see the familiar ODATA entities:
In this example we will only use the Projects feed:
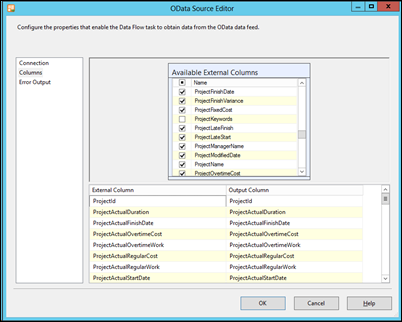
Click the Columns page on the left hand side and select the columns you want:
Click OK.
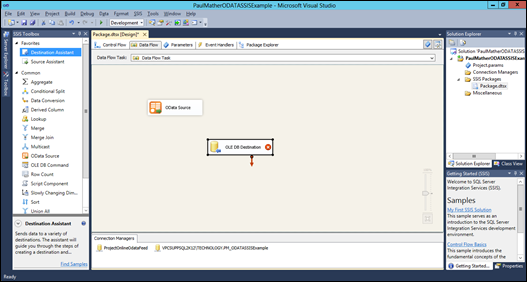
Drag the Destination Assistant from the SSIS toolbox to the Data Flow sheet and the new destination window will open:
Select the previously created SQL Server OLE DB connection:
Click OK.
Link the ODATA Source to the OLE DB Destination component using the blue data flow, then double click the OLEDB Destination component to load the editor – click yes to the warning / pop up:
Click the New button next to to the table details to create a new table, give the table a name, replace “OLE DB Destination” with the table name you want:
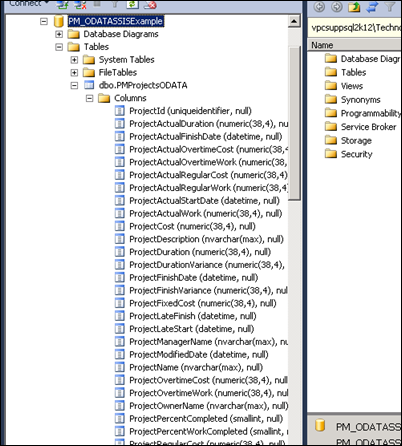
Click OK. At this point if we look at the SQL database we will see the new table and columns:
Back in the SSIS package click the Mappings page, here you can see the field mappings from the ODATA feed to the SQL table:
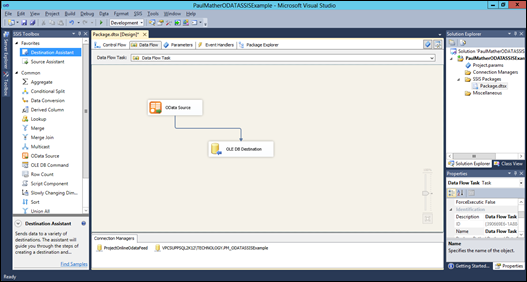
Click OK and you will see the following flow:
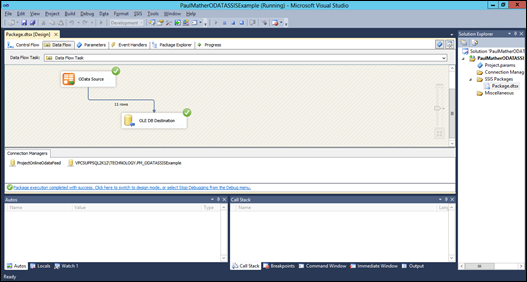
Run the package using the green arrow:
Once run successfully you will see the following:
If we switch back to the SQL server and see what is stored in the table you will see the project data from your Project online tenant:
Now the data is local you can use SQL Server Reporting Services to create reports, you can integrate this data into other LOB systems or create a custom OLAP cube etc. Once you are happy with the package you can set the package to run on a schedule to periodically copy the data down. There are plenty of references on the web for creating SSIS packages so have a search.
This is a basic example but hopefully gives you the idea of what is now possible 
#Odata #SQL SSIS component now available for SQL Server 2012 #ProjectOnline #SSRS #SharePointOnline #SharePoint #BI
March 26, 2014 at 9:16 am | Posted in Add-on, Administration, Configuration, Customisation, Functionality, Information, Reporting, T-SQL | 1 CommentTags: Project 2013, Project Online, PS2013, SharePoint Online, SP2013, SQL, SSRS
Quick post to let you know that the SSIS component to export data via ODATA that was mentioned here is now available for download, see the link below:
This will enable you to copy data from Project Online into a custom SQL database, from there you can easily create SSRS reports, custom OLAP cubes, integrate into other LOB systems etc. Look out for more details soon.
#SSRS for #ProjectOnline by #FluentPro #PS2013 #Office365 #Cloud
February 2, 2014 at 3:28 pm | Posted in Administration, Configuration, Customisation, Functionality, Information, Reporting, T-SQL | Comments Offon #SSRS for #ProjectOnline by #FluentPro #PS2013 #Office365 #CloudTags: Office365, Project 2013, Project Online, Project Server 2013, PS2013
A quick post to highlight a recently approved app that allows you to report on your Project Online data with SSRS!
This is great, something I know a lot of people would have been waiting for!
#ProjectServer #Excel report with SQL Temporary Tables #PS2010 #PS2013 #SQL
July 19, 2013 at 11:45 pm | Posted in Administration, Configuration, Customisation, Functionality, Information, Reporting, T-SQL | 1 CommentTags: Excel Services, Office 2010, Office 2013, PPM, Project 2010, Project 2013, Project Server 2010, Project Server 2013, PS2010, PS2013
I came across an issue a while back and meant to blog about it but forgot until a colleague of mine today mentioned the same issue. This jogged my memory of the fix so I thought it was a good time to write the post. The issue isn’t Project Server related but the reports and queries we were creating were for Project Server.
If your SQL query in an Excel file uses temporary tables Excel will throw an error like the one seen below:
For the search engines the error is below:
The query did not run, or the database table could not be opened.
Check the database server or contact your database administrator. Make sure the external database is available and hasn’t been moved or reorganized, then try the operation again.
The error will occur if you have the select statement in the connection file definition command text or even calling a SQL stored procedure from the command text. The same fix applied to both, at the start of the select statement add “SET NOCOUNT ON” as shown below:
Now Excel will execute the query and return the data as expected. 
#ProjectServer #SSRS Report with multivalued parameters #SQL #PS2010 #SP2010
March 17, 2013 at 6:03 pm | Posted in Configuration, Customisation, Functionality, Reporting, T-SQL | 1 CommentTags: Project 2010, Project Server 2010, PS2010, SQL, SSRS
A quick blog post to highlight the use of one of the Project Server Reporting database functions to resolve an issue when using an SSRS multi value parameter.
There are several methods to get multi value parameters working in SQL Server Reporting Services (SSRS) including dataset filters, joining parameters and custom SQL functions – other blogs / forum posts detail these. This post demonstrates using a function that is available in the Project Server Reporting database. The function is called MSP_FN_Utility_ConvertStringListToTable. An example SQL Stored Procedure that will allow multi values can be seen below:
CREATE PROCEDURE [dbo].[SP_ProjectData] (
@ProjUID NVARCHAR (max)
)AS
BEGIN
select P.ProjectName
, T.TaskName
from MSP_EPMProject_UserView P
INNER JOIN MSP_EPMTask_UserView T
ON P.ProjectUID = T.ProjectUID
INNER JOIN MSP_FN_Utility_ConvertStringListToTable (@ProjUID) AS PU
On P.ProjectUID IS NULL or P.ProjectUID like PU.TokenVal
END
@ProjUID NVARCHAR (max)
)AS
BEGIN
select P.ProjectName
, T.TaskName
from MSP_EPMProject_UserView P
INNER JOIN MSP_EPMTask_UserView T
ON P.ProjectUID = T.ProjectUID
INNER JOIN MSP_FN_Utility_ConvertStringListToTable (@ProjUID) AS PU
On P.ProjectUID IS NULL or P.ProjectUID like PU.TokenVal
END
Create the SQL query as normal but instead of using a where clause to filter the Project UIDs join on to the function as shown above.
#ProjectServer #PowerView report in #Excel 2013 #PS2010 #PS2013 #Office2013
March 1, 2013 at 11:51 pm | Posted in Administration, Configuration, Functionality, Reporting, T-SQL | 2 CommentsTags: EPM, Office 2013, Project 2010, Project 2013, Project Server 2010, Project Server 2013, PS2010, PS2013
This post will take a brief look at creating a map view of Project Server data – this does assume you tag your projects with a location!
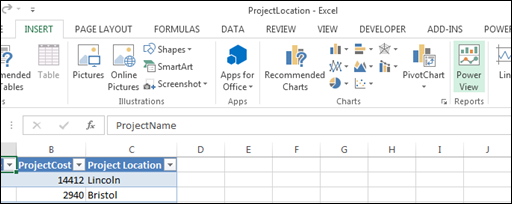
For the purpose of this post I will use the example Excel file shown below – this pulls data from one of my test Project Server PWA instances, hence the project names!
In Excel 2013, click Insert > Power View Reports:
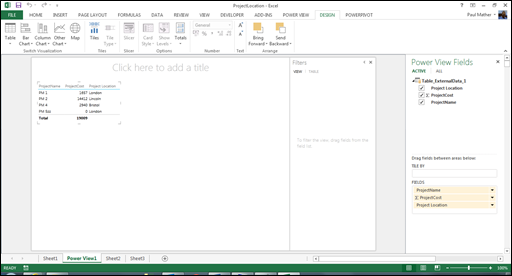
You will now see a Power View report:
To create a map with the projects plotted in the correct location by cost, see the steps below.
On the design tab, click Map and you will see the following:
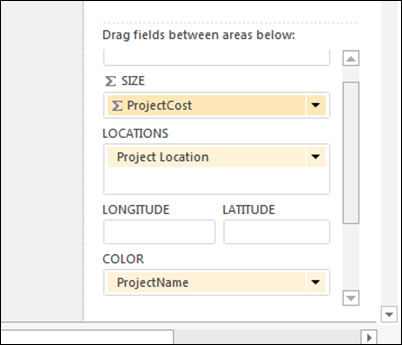
Now click the map and modify the Power View fields shown below:
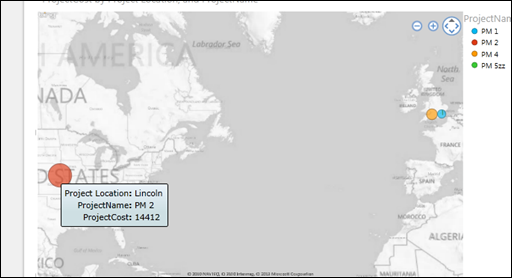
For this example, add ProjectCost to the size property, add Project Locations to the Locations property and set the colour property to ProjectName:
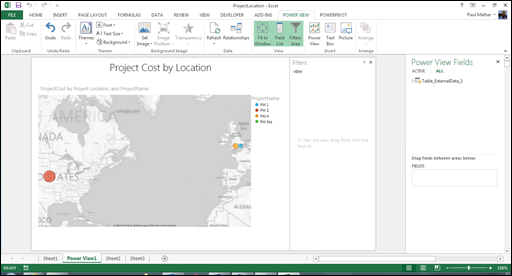
Increase the size of the map and add a title:
You can hover over the data circles and a tooltip will appear with the project details:
The data can be refreshed and the map updates.
A quick and simple report to show projects by location.
#ProjectServer 2010 Resource assignments display issue #PS2010 #SP2010 #PS2013 #SP2013
September 20, 2012 at 7:44 pm | Posted in Functionality, Issue, Reporting, T-SQL | 1 CommentTags: Project 2010, Project Server 2010, PS2010
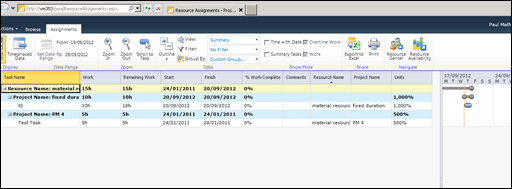
Recently I was reminded of a minor issue that I thought I would share with you. While working with a client for a recent migration from Project Server 2007 to Project Server 2010, a query was raised regarding material resources and the resource assignment view in PWA. Material resources show a work and remaining work value with an hours ‘h’ label in 2010, in 2007 this displayed the material resource label. This is only a display issue, the underlying data is still correct in the Reporting database, so your reports will be correct. An example in PWA 2010 can be seen below:
I have a material resource named ‘material resource’ (sorry about the poor names used on my test system, I should really use some imagination!), I have assigned this material resource to two tasks, one task has 10 units and the other has 5 units. As you can see from the screen shot above, this displays 10h and 5h rather than 10 material resource and 5 material resource as you would have seen in 2007. Example shown below for PWA 2007:
As mentioned the Reporting data is still correct, see the example SQL output below:
The assignment work column correctly shows 0 and the assignment material work shows 10 and 5.
This is also an issue with the Project Server 2013 preview.
Just a minor display issue that I thought I would share in case anyone else came across this 
#ProjectServer optimisations for #SQL Server and #PS2010 databases #SP2010 #MSProject
September 14, 2012 at 9:25 pm | Posted in Administration, Configuration, Installation, T-SQL | 2 CommentsTags: Project 2010, Project Server 2010, PS2010, SQL
https://technet.microsoft.com/en-us/library/cc298801(v=office.14).aspx#Section6_3A quick blog post to show the recommended SQL Server and database settings for optimal performance of your Project Server environment. See the SQL queries below along with the TechNet documents for reference.
SQL CLR:
sp_configure ‘clr enabled’, 1
go
reconfigure
go
Print ‘CLR Enabled’
go
reconfigure
go
Print ‘CLR Enabled’
SQL Server MAX Degree of Parallelism (Specific for SharePoint 2010):
sp_configure ‘show advanced options’, 1;
GO
RECONFIGURE WITH OVERRIDE;
GO
sp_configure ‘max degree of parallelism’, 1;
GO
RECONFIGURE WITH OVERRIDE;
GO
Print ‘Max degree of parallelism set to 1’
GO
RECONFIGURE WITH OVERRIDE;
GO
sp_configure ‘max degree of parallelism’, 1;
GO
RECONFIGURE WITH OVERRIDE;
GO
Print ‘Max degree of parallelism set to 1’
Server-wide default fill factor:
sp_configure ‘show advanced options’, 1;
GO
RECONFIGURE;
GO
sp_configure ‘fill factor’, 70;
GO
RECONFIGURE;
GO
PRINT ‘Default server-wide fill factor set to 70 %, restart the SQL Service’
GO
RECONFIGURE;
GO
sp_configure ‘fill factor’, 70;
GO
RECONFIGURE;
GO
PRINT ‘Default server-wide fill factor set to 70 %, restart the SQL Service’
Auto_Close and Auto_update_statistics_async:
Update the database names for your Project Server PWA databases.
Alter Database VM353_PWA_Archive
Set AUTO_CLOSE OFF, AUTO_UPDATE_STATISTICS_ASYNC ON
Alter Database VM353_PWA_Draft
Set AUTO_CLOSE OFF, AUTO_UPDATE_STATISTICS_ASYNC ON
Alter Database VM353_PWA_Published
Set AUTO_CLOSE OFF, AUTO_UPDATE_STATISTICS_ASYNC ON
Alter Database VM353_PWA_Reporting
Set AUTO_CLOSE OFF, AUTO_UPDATE_STATISTICS_ASYNC ON
PRINT ‘Project Server databases auto close set to off and auto update stats asynchronous set to on ‘
Set AUTO_CLOSE OFF, AUTO_UPDATE_STATISTICS_ASYNC ON
Alter Database VM353_PWA_Draft
Set AUTO_CLOSE OFF, AUTO_UPDATE_STATISTICS_ASYNC ON
Alter Database VM353_PWA_Published
Set AUTO_CLOSE OFF, AUTO_UPDATE_STATISTICS_ASYNC ON
Alter Database VM353_PWA_Reporting
Set AUTO_CLOSE OFF, AUTO_UPDATE_STATISTICS_ASYNC ON
PRINT ‘Project Server databases auto close set to off and auto update stats asynchronous set to on ‘
Please note, if copying and pasting the SQL queries from this post you may need to delete and re-enter the apostrophes.
Also remember the database maintenance plans:
Project Server 2010: http://technet.microsoft.com/en-us/library/cc973097.aspx
SharePoint 2010: http://technet.microsoft.com/en-us/library/cc262731.aspx
#SharePoint 2007 / 2010 and #ProjectServer 2007/ 2010 #BI Reporting made easy #SP2010 #PS2010 #businessintelligence #SQL
August 22, 2012 at 12:36 pm | Posted in Add-on, Administration, Configuration, Customisation, Functionality, Information, Reporting, T-SQL | 1 CommentTags: Project 2010, Project Server 2010, PS2010, SharePoint 2010, SP2010, SQL, SSRS
Following from my previous post where I briefly introduced a new product from CPS called SharePoint ReportLink, as promised, this post demonstrates the ease of use and ease of reporting on SharePoint data when using SharePoint ReportLink.
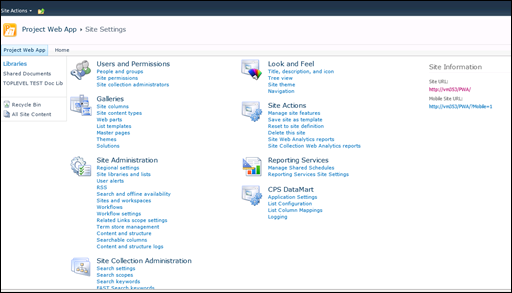
For the purpose of this blog post, I have already deployed the solution to my test VM. Worth noting at this point, the version I have installed / used for this blog post is not the final release so you will see CPS DataMart referenced as this was the original product name. Functionally the version I have installed on my VM is probably 99% identical. Firstly I need to activate the feature on the site collection, in this case it is one of my PWA site collections. Once the feature is activated a new heading / menu appears on the Site Settings page for that site collection:
You will see CPS DataMart with four links, Application Settings, List Configuration, List Column Mappings and Logging. We will take a look at each page in turn, firstly the Application Settings page:
I didn’t set any database server or database name, as this is has been activated against a PWA site collection the feature automatically populates the database server with the Project Server Reporting SQL Server name and the name of the Project Server reporting database – pretty cool! You can of course update the settings to use a different database server and custom database. If this feature is activated against a normal SharePoint site collection you will see the following on the Application Settings page:
As you can see there is also a logging level, by default this is set to Information but can be updated:
The SharePoint ReportLink will log events to a custom list to ease diagnostics.
Let’s take a look at the next two page pages together, List Configuration and List Column Mappings.
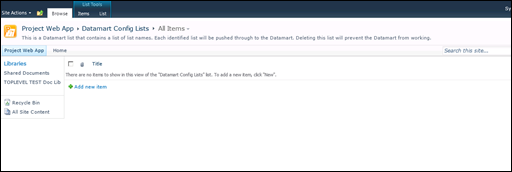
List Configuration:
List Column Mappings:
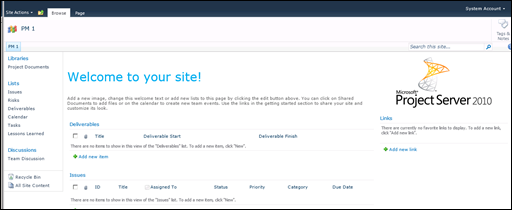
As you can see these are just standard SharePoint lists, at this point you need to know what lists and what columns on those list you wish to report on. For the purpose of this blog post I will report on the Issues, Risks and Lessons Learned from my projects sites:
See below the populated / configured List Configuration and List Column Mapping lists:
Once the CPS SharePoint ReportLink is activated and configured on the site collection, any items on the lists configured will be synchronised to the SharePoint ReportLink database tables in real time. This includes, new items created, existing items modified and items deleted from those configured lists across all webs within that site collection.
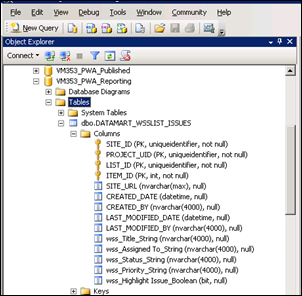
After setting the List Column Mappings, custom tables will be created in the specified SharePoint ReportLink database, in this case the Project Server Reporting database:
Tables:
Issues list columns:
If those lists already contain items, after setting the column mappings the existing SharePoint items will be created in the SharePoint ReportLink tables.
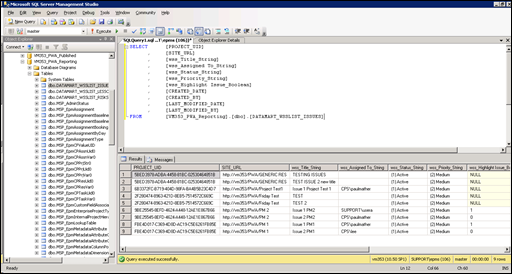
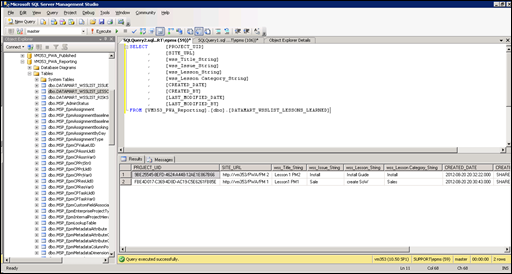
I then created a few new items on the lists (on PM 1 and PM 2 sites, other items already existed), as you can see from below, the data is available in the custom tables in the reporting database:
Issues:
Lessons Learned:
As you can see, you can quickly and easily access the SharePoint list data from multiple sites using T-SQL. Also notice the Project_UID, this enables you to easily link the SharePoint ReportLink data to your Project Server data. If SharePoint ReportLink reads data from a non Project Server project site, the Project_UID column will contain an empty GUID.
The final menu we haven’t seen yet is the logging list, this can be seen below:
The warnings are logged above as the new custom list, Lessons Learned, doesn’t exist on the majority of my test project sites.
Now that the SharePoint data is easily accessible using T-SQL, reporting could not be simpler using your preferred reporting tool, SSRS, Excel etc. SharePoint BI made easy!
In case you didn’t see the first post, I have included links to the product below:
I will follow up with a third post and create an SSRS report including the SharePoint ReportLink data in the near future.


